
The Moving Averages in Forex
2 min readThe Moving Averages in Forex
The Moving Averages are a type of trend indicators. They show the average price of an instrument over a certain period of time. When calculating the Moving Average, there is carried out a mathematical averaging of the currency pair price during a given period. As the price changes, its moving average also increases or decreases.
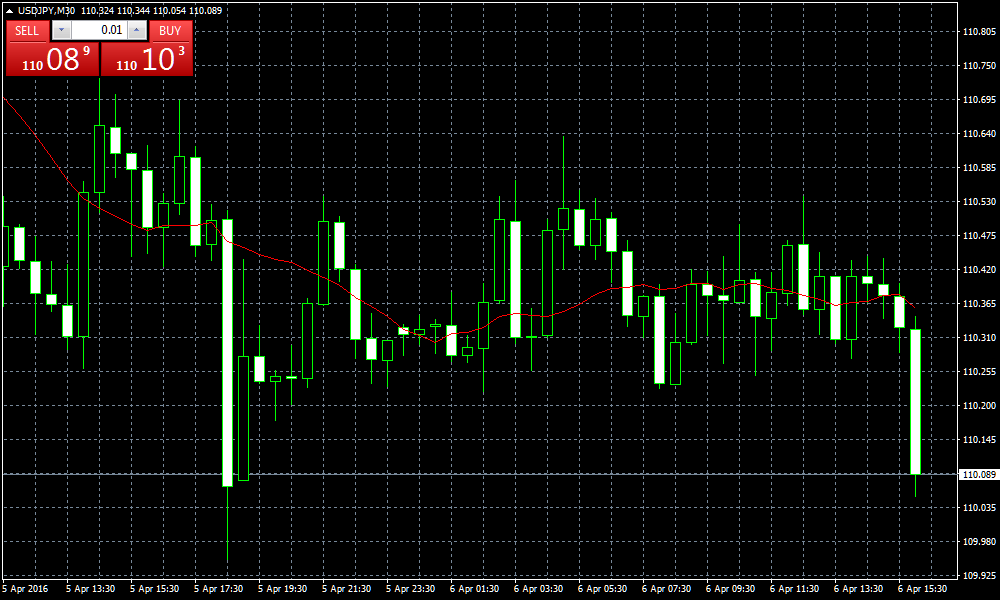
Here is an example of a Moving Average with the period 14 (the red line):
If you know how to read the Moving Average (MA) signals, you can easily predict the future price behavior. When using this technical indicator, traders should keep in mind that:
– The greater the period of the moving average, the less sensitive the MA will get to changes in price action;
– Moving average with a very small period will generate a lot of false signals – it will just go after the price);
– Moving Average with a very large period is constantly delayed – it reacts too slowly;
– When there is a sideways trend, it is necessary to use moving averages with higher period.
There are 4 types of moving averages:
• Simple Moving Average (SMA) – the simple moving average is calculated by adding up the closing prices of the currency pair over a certain number of time periods (like 34 hours) and then dividing the sum by the number of periods.
• Exponential Moving Average (EMA) – the exponential moving average is calculated by adding to the previous value of the simple moving average (discussed above) a certain share of the recent close price. When using an exponential moving average, the recent prices have a bigger impact.
• Smoothed Moving Average (SMMA) – the smoothed moving average is calculated on the basis of a simple moving average, but it is more resistant to price fluctuations.
• Linear Weighted Moving Average (LWMA) – when the linear weighted moving average is calculated, the latest data receives a greater weight, while the earlier data have less relevance.
Weighted moving average is calculated by multiplying the close prices within the considered series, by a certain weight coefficient.
In the analysis of the chart, moving averages can form 2 main signals:
– The point of intersection of the moving average with the price action generates a Buy signal if the price crosses the moving average upwards and a Sell signal if the price crosses the moving average downwards.
– The general direction of the moving average indicates the current trend at the moment, so opening a position is recommended only in the direction of the current trend.