
The Japanese Candlesticks in Forex
2 min readThe Japanese Candlesticks In Forex
In this article we will discuss the Japanese candlestick chart type, as it is one of the most popular methods to display price movement. Many professional and beginner Forex traders prefer particularly this chart type because the candlestick shape comprises a lot of information about the analyzed financial instrument. Moreover, it’s not only the candlestick alone: there are many special combinations of them, called patterns, which can tell you about the market situation and accurately predict the future tendency.
But, first of all, let us understand – why these candlesticks are called Japanese? Well, as you may guess, this method comes from Japan. In the beginning of the XVIII century, Japanese merchants founded their own school of technical analysis. The inventor of this particular graphic system of analysis was a Japanese rice merchant – Munehisa Homma from Sakata. The system was discovered and then made popular by Steve Nison, a US trader and analyst, and a well-known expert in the Forex trading.
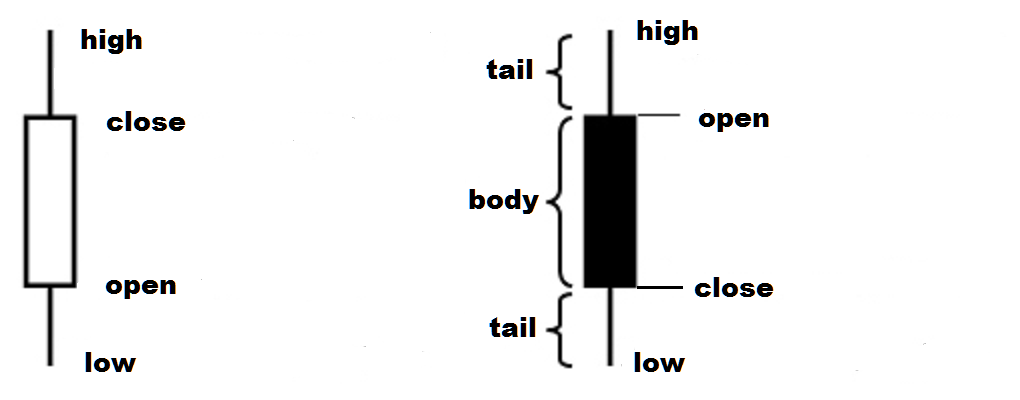
So, what’s the secret of this graphical method? Well, it’s actually very simple. Here is how the candlestick chart looks like:
To understand the principle of this graphic, we will speak about a candlestick apart. Every Japanese candlestick shows us 4 key price characteristics during a given period. These are:
– Open price
– High price
– Low price
– Close price
Accordingly, when we use the daily time-frame (D1), one single candlestick will indicate us the open price during that particular day, the close price, the maximum level, and the lowest level, all making reference for the same period which is one day. If we change the time-frame, we will get the same kind of info applied to that particular period. It can be H1, M15, H4, W, and so on. Here is how it looks like:
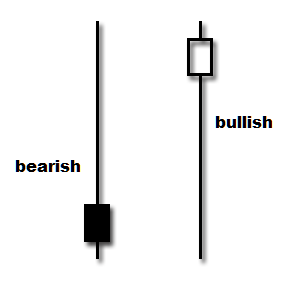
As you can see on the image, the first candlestick is transparent (white) and the other is colored (black). If you look at the open and close price, they have changed their places. It is because each candlestick shows us the price direction. The first candlestick is called bullish – as it goes upwards, and the second one from the image is called bearish – as it points downwards.
Now, once you know the story behind the candlesticks, let’s analyze the main types of them:
Pin-bar – a reversal pattern (shows a change in the trend) with one long tail and a small body;
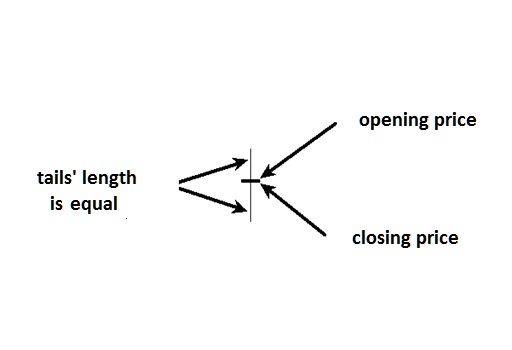
Doji – it is formed when the price has closed nearly at the same level of the opening price. Accordingly, it has long tails and a small body.
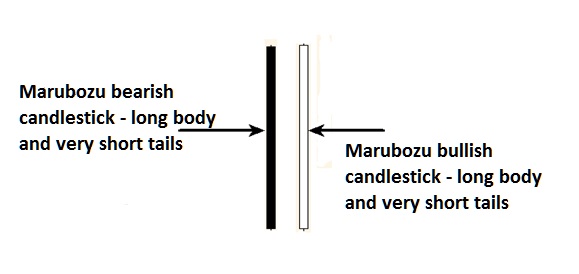
Marubozu – a continuation pattern (it shows the trend goes on) with a long body and small tails.
Once you analyze more in depth the candlesticks, it will much easier for you to make a decision prior to opening a position on your Forex platform.